
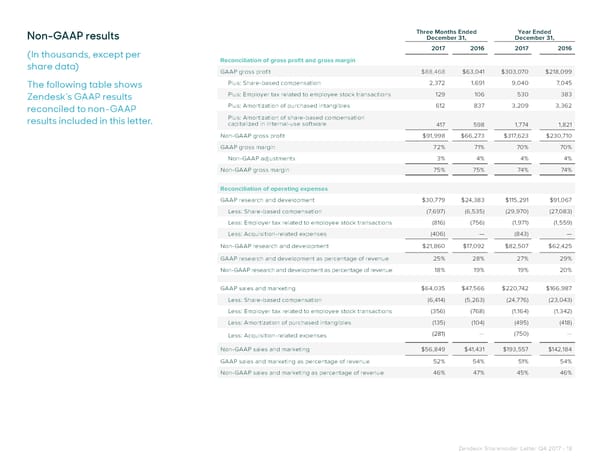
Non-GAAP results Three Months Ended Year Ended December 31, December 31, (In thousands, except per 2017 2016 2017 2016 share data) Reconciliation of gross profit and gross margin GAAP gross profit $88,468 $63,041 $303,070 $218,099 The following table shows Plus: Share-based compensation 2,372 1,691 9,040 7,045 Zendesk’s GAAP results Plus: Employer tax related to employee stock transactions 129 106 530 383 reconciled to non-GAAP Plus: Amortization of purchased intangibles 612 837 3,209 3,362 results included in this letter. Plus: Amortization of share-based compensation capitalized in internal-use software 417 598 1,774 1,821 Non-GAAP gross profit $91,998 $66,273 $317,623 $230,710 GAAP gross margin 72% 71% 70% 70% Non-GAAP adjustments 3% 4% 4% 4% Non-GAAP gross margin 75% 75% 74% 74% Reconciliation of operating expenses GAAP research and development $30,779 $24,383 $115,291 $91,067 Less: Share-based compensation (7,697) (6,535) (29,970) (27,083) Less: Employer tax related to employee stock transactions (816) (756) (1,971) (1,559) Less: Acquisition-related expenses (406) — (843) — Non-GAAP research and development $21,860 $17,092 $82,507 $62,425 GAAP research and development as percentage of revenue 25% 28% 27% 29% Non-GAAP research and development as percentage of revenue 18% 19% 19% 20% GAAP sales and marketing $64,035 $47,566 $220,742 $166,987 Less: Share-based compensation (6,414) (5,263) (24,776) (23,043) Less: Employer tax related to employee stock transactions (356) (768) (1,164) (1,342) Less: Amortization of purchased intangibles (135) (104) (495) (418) Less: Acquisition-related expenses (281) — (750) — Non-GAAP sales and marketing $56,849 $41,431 $193,557 $142,184 GAAP sales and marketing as percentage of revenue 52% 54% 51% 54% Non-GAAP sales and marketing as percentage of revenue 46% 47% 45% 46% Zendesk Shareholder Letter Q4 2017 - 18
 Shareholder Letter Page 17 Page 19